Hi there. Thanks for stopping by. I hope you had a splendid start into the New Year and wish you all the best for 2017!
I want to share with you some achievements we made in 2016 in regard of our savings rate.
Income, spendings and savings in 2016
The savings rate is the percentage of our disposal income being able to set aside as our nest egg and to invest.
Our income consists of
- our take-home pay
- dividends and
- interest income.
Our portfolio contributes around USD 4’000 per year in passive income. I expect that amount to grow by around 15 % year over year as it did in the past (see Passive Income Review 2016 and Outlook).
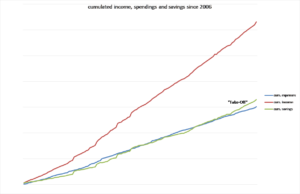
The graph above shows our cumulated income (red line), spendings (green line) and savings (blue line) since 2006.
As you can see, income was more or less constant over the years.
The key driver in our wealth accumulation process is our systematic approach to consistently keep spendings under control. This is the lever we can directly have an influence on. As you can see on the chart, for over a decade we have been able to consistently widen the gap between income and spendings and increased the savings rate quite nicely over time.
In 2011, our savings rate reached 50 % for the first time (green “savings-line” equals the blue “spending-line”). We kept that level for around three years.
Then in 2015, a kind of “take-off” happened: our savings-rate slowly, but steadily climbed well above 50 %.
2016 was another successful year in regard of our financials as following important milestones could be achieved:
- October 2016: first monthly savings rate above 65 % (see Hooray, another awesome boost to our savings rate)
- September – December 2016: four months with steadily increasing savings rates in a row (56 %, 65.7 %, 68.5 %, 69 %)
- Full year 2016: average savings rate of 57.5 %
These strong results encourage us to take our efficiency improvements even further. Our next target:
an average savings rate of 65 % through 2017.
How we optimise our cost structure
Tackling the fixed costs block
I’ve been tracking our expenses for more than ten years now and it clearly shows that slashing our fixed costs block was the most effective measure to take. Once we were able to reduce these expenses, the realized savings occur each year. It’s like an annuity paying us back again and again.
So what are fixed costs of a household?
These are spendings that cannot be easily changed in the short run and are usually paid monthly, quarterly or from year to year. For example:
- our rent
- insurances (health insurance, car insurance, house insurance etc.)
- memberships
- mobile subscriptions
The basis for fixed costs are always (long term) contracts. So the approach to tackle these costs are as follows:
- compare
- negotiate
- substitute
- slash
The key question is alway “(how) can we get at least the same quality of the services for less money“?
Cost optimisation is an iterative and open process. It’s rather about implementing a system than a set of measures.
And from time to time we find out, that no change is needed at all as the status quo is already very good. In case of our apartment for instance we realized that our current rent compares very favourably towards other apartments of the same size and location. We are a family of four and live in a very nice 100 m2 flat. It’s comfortable, our neighbours are friendly and we have everything we need around us (our jobs etc.). For the moment we are happy where we live and that’s why we decided not to make any change in the near term (but of course we are still looking for our dreamhouse).
Leading a down to earth lifestyle
Over and over again my wife and I made the experience that being conscious regarding our resources and focus on meaningful things makes much happier than costly habits. For instance, cooking at home makes more fun than eating outside.
There is nothing wrong with consumption per se. It’s just that I don’t feel the need to spend additonal money above a certain amount or above a certain lifestyle level.
How could for example buying a luxury watch for USD 20’000 enhance the quality of my life? I don’t need to impress anybody! My family and friends love me the way I am and achievements in my private life and work career speak for themselves. I’d rather buy shares of the company producing luxury watches and take pleasure of seeing dividend payments coming in.
Well, maybe that’s my next investment idea.
How was your 2016 in terms of your financials? Are there major successes?
Congrats on a fantastic 2016 savings rate. you’re doing it right. It’s not about how much you make, it’s how much you save and invest. $4,000 a year in passive income is proof that you’re on the right track. Best of luck with your goals this year.
Hi IH, thanks for the kind words.
There is some nice momentum with regard to our efforts (saving and investing) now and the results encourage us to keep on track.
Appreciate you stopping by!
Cheers
Wow, that’s a legit savings rate! Congrats and best of luck in 2017. I’m impressed that you’re aiming to improve it in 2017 since it’s already so high!
Hi TITM
Thanks for the kind words. Yes, our results in 2016 really encouraged us to set the bar higher to a 65 % savings rate. It is ambitious but for now it seems quite feasible over the next months as our income will be a bit higher and our efforts last year to reduce our fixed cost block should now pay off quite nicely.
Appreciate your commentary!
Cheers